Statistics always trail what is actually happening in a marketplace, and thus it is difficult to predict market tops or bottoms. However, there have been many recent reports of increasing sales in various areas of the country, gradual stabilizing of price levels in the lower-priced sections of many states, and other potentially beneficial responses to the government programs and loan industry actions.A review of local price trends over the past year between decreasing home values and the increase in the unsold homes inventory shows a clear relationship. Since September 2008, the steady increase in numbers of homes available for sale has accelerated the general decline in market values. Comparing the price per square foot of properties sold may be a more accurate indicator of price movement than using the average or median price level differences. Depending on specific time periods and individual Westside neighborhoods, prices are lower by 25-30% from their highs of 2007.For homes for sale in different price ranges, there is a significant difference in the rate of sales compared with inventory levels. For example, while it would take 10 months to sell all the homes now listed in Santa Monica, Brentwood and the Pacific Palisades below $4 million, it would take about two years to sell all of the homes for sale over $4 million at the rate they have been selling for the past year. As of May 26, there are a total of 110 escrows open in those three areas, only 13 of which are above $4 million. A recent sign of improvement benefitting sellers is that for the second month in a row we have seen an increase in the number of Westside homes in escrow, with more contracts pending than there have been since September 2008. This in turn has resulted in a slight decrease in both the growth of inventory and diminishing of sale prices in these areas. While obviously this is another way of saying the news is not as bad as it was in the preceding several months, it may indicate a possible shift in the market.What was thought to be a leading indicator of a turn in the market in September 2008 was the ratio of escrows opened as compared to new listings coming on the market in these three areas. This ratio had generally ranged between 90-100% for the past six years, before dipping below 50% in September. After hitting a low of 22 and 24% between October and January, the ratio has been between 40-70% for the past three months. This may be the first sign of the local market turning towards more balance between sellers and buyers. The anecdotal observation of greater number of showings, larger turnouts at open houses and more offers written on well-priced properties is a trend that has continued into the middle of May. Multiple offers have continued to occur and buyers’ perception of good market value has steadily become more apparent month-by-month. For the past 23 years Michael Edlen has provided real estate counseling services to prospective buyers and sellers. More tips and information are available on MichaelEdlen.com. He can be reached at 310.230.7373 or Michael@MichaelEdlen .com.
You might be interested in …
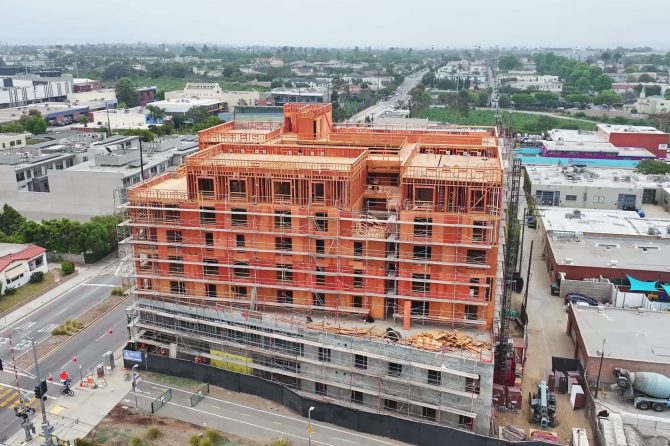
1634 W. 20th Street- Framing. Photo Credit: United Building Company
Seven-story affordable housing project reaches framing phase in Santa Monica
The 78-unit joint development from Venice Community Housing and Community Corp. near the E Line remains on track for a 2027 opening. Construction crews have begun framing the upper levels of a seven-story affordable housing […]

Supergirl and Krem.
Film Review: Supergirl
FILM REVIEWSUPERGIRLRated PG-13107 MinutesReleased June 26th This is not your grandmother’s Supergirl. Gone are the perfect sweet smiles and sparkling, neatly tight bodysuit, the shining example of charm, strength, and feminine heroism. This contemporary version […]

Illegal Fireworks Can Cost You More Than the Show (Video)
Consumer fireworks are illegal in the city of L.A. and unincorporated L.A. County. Violators face steep fines, jail time, or both.

Bar Next Door
LA History-Inspired Cocktails Debut on the Menu at Sunset Strip Bar Bar
West Hollywood bar Bar Next Door adds the Trocadero and Gardner Street drinks, paying tribute to classic Los Angeles landmarks and Hollywood’s golden era. Bar Next Door on the Sunset Strip has added two new cocktails inspired […]

Office of Karen Bass
Japanese Cultural Gifts Restored at LA Convention Center
The Los Angeles-Nagoya sister city relationship was established in 1959, the first such partnership for Los Angeles. Historic cultural gifts from Nagoya, Japan, Los Angeles’ oldest sister city, have been restored and placed on public […]
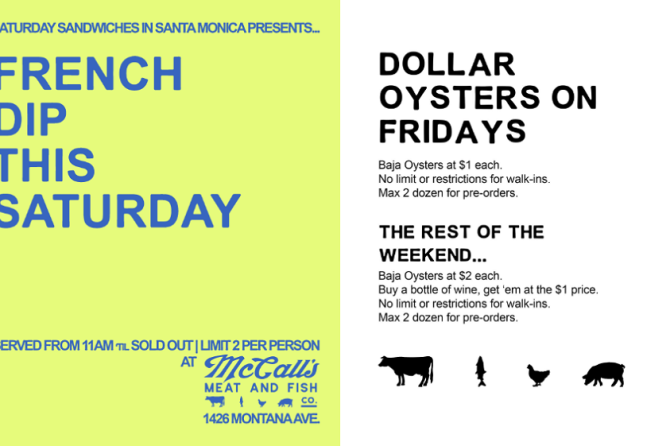
McCall’s Meat and Fish on Montana with French Dips and Dollar Oysters. Photo Credit: Instagram.
Reminder: McCall’s Meat and Fish weekly $1 oyster deal and Saturday French Dip special
The Santa Monica market features its long-running Baja oyster discount alongside this weekend’s hot sandwich lineup on Montana Avenue. McCall’s Meat and Fish has two very great specials this weekend at its Montana Avenue location […]

Los Angeles chefs and bakeries launch Westside food events for Venezuelan earthquake relief
Local spots like The Arepa Stand, Petitgrain Boulangerie, and Chainsaw organize menu specials to fund medicine and food. By Dolores...
Read more


CHP launches Fourth of July crackdown with 100 undercover patrols
State troopers deploy low-profile vehicles to target holiday speeders. The California Highway Patrol will initiate its maximum enforcement period beginning at 6...
Read more